Performance
On a 2 vCPU / 8 GB cloud VM shared with PostgreSQL, Kafka and the load driver, Tandem delivers COMMIT → ack at a p99 of 148 ms while carrying 600 events a second, and sustains up to 1450 events/s.
Zero lost events and zero ordering violations in every scenario, at every rate — including the rates the host could not keep up with.
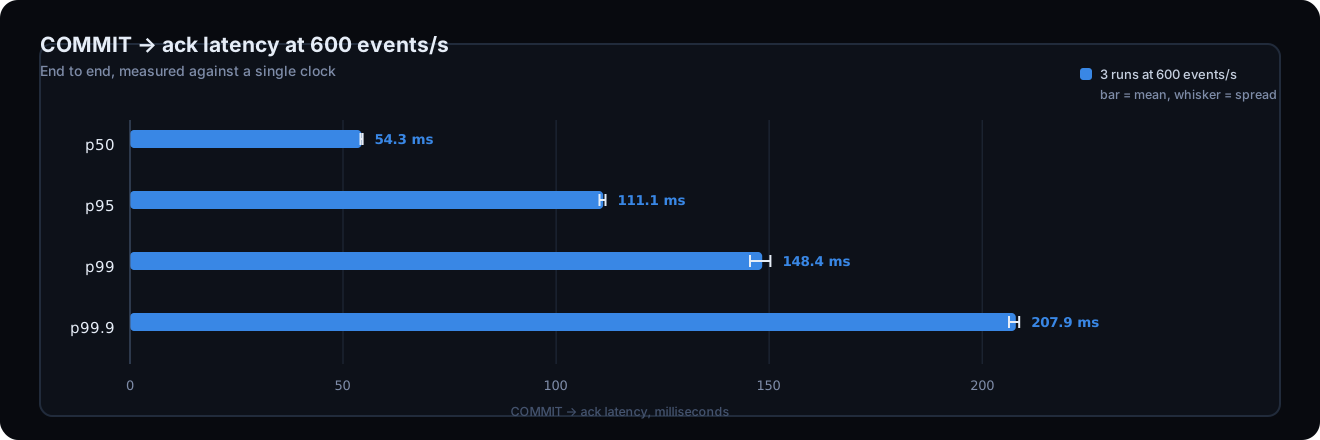
COMMIT → ack at 600 events/s. p50 54 ms, p95 111 ms, p99.9 208 ms.
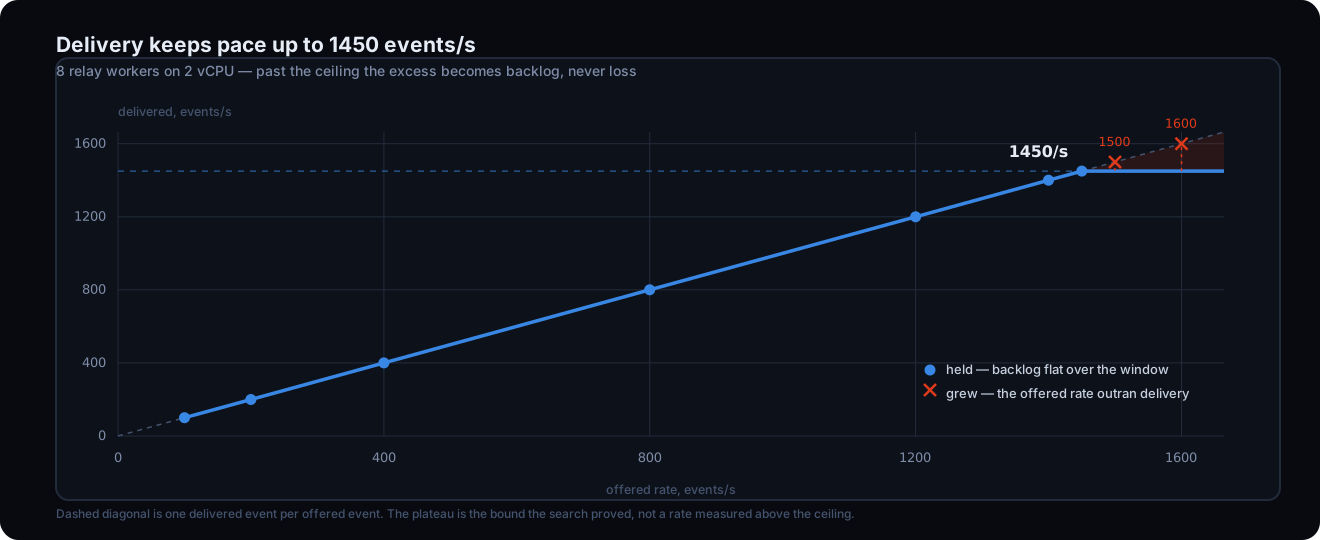
Highest rate delivered with the backlog flat, bracketed below 1500/s on two cores shared with the database and the broker.
Across all seven scenarios — saturation past the ceiling, a relay killed mid-flight, an undeliverable event, three instances with one killed outright.
Latency
The clock starts when the producing transaction commits and stops when Kafka acknowledges the publish, both read on the same machine — which is why the database and the broker share this host.
Throughput
Up to the ceiling the relay delivers one event for every event offered and the backlog stays flat — a handful of rows pending at any moment, whatever the rate. Past it nothing fails and nothing is dropped: the excess accumulates in the outbox and drains once the offered rate falls back.
What sets the limit
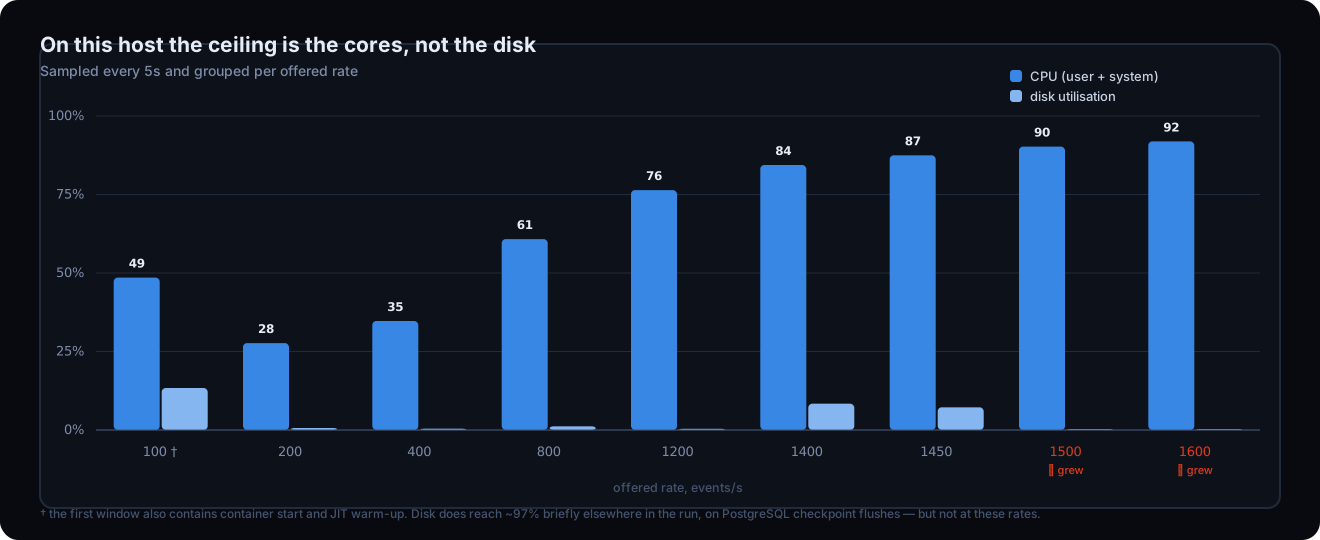
What runs out at the ceiling is CPU: it reaches 87% of both cores while disk utilisation sits at 7% and the relay waits on I/O for well under one percent of its time. The bottleneck here is computation — encoding, publishing and polling — not the rate at which the database writes to disk.
Scenarios
A pass means zero ordering violations and zero lost events — never a throughput threshold. One row is marked HOST: the scenario hit a limit of this two-core VM, not of Tandem.
| Scenario | What it does | Result | Observed |
|---|---|---|---|
| Sustained throughput | Finds the highest rate the relay holds | PASS | 1450 events/s, ceiling bracketed below 1500/s |
| Latency at normal load | Holds 600 events/s and times every event | PASS | p50 54.1 ms, p99 145.5 ms |
| Hot partition | Sends 80% of traffic to one aggregate | PASS | 1480 rows queued behind the hot bucket; the rest kept flowing |
| Saturation | Drives deliberately past the ceiling, then stops | HOST | Backlog drained, but two cores need longer than the 9-minute window; nothing lost or reordered meanwhile |
| Worker failover | Kills the relay mid-flight and restarts it | PASS | 0 duplicates against a bound of 800 |
| Poison message | Injects an event that can never be delivered | PASS | Its aggregate blocked; every other aggregate unaffected |
| Multi-instance coordination | Runs three relays and kills one outright | PASS | Survivors re-took its 84 buckets, 256 of 256 covered, no duplicates |
Test environment
| Host | AWS m7i-flex.large — 2 vCPU, 8 GB, Ubuntu 24.04, native Docker,
eu-central-1 |
| Topology | PostgreSQL, Kafka, the relay and the load driver on one machine, so COMMIT → ack is measured against a single clock |
| Relay | 8 workers, batches of 100, 256 buckets |
| Events | 1 KB payloads |
| Producer | acks=all, enable.idempotence=true — the production-mandated
settings, never a faster configuration for the sake of a number |
Treat these as a floor. Latency is stable on this host; sustained throughput is not: this is a burstable instance, whose capacity moves with recent CPU use, and its ceiling ranges from 725 to 1450 events/s. Those two cores also carry PostgreSQL, Kafka and the load driver alongside the relay, so a host with cores of its own should do better on both counts.
Every figure is backed by its raw run — logs, resource samples and the script that redraws these charts from them — in docs/benchmark-results. The methodology is in HLD-load-testing.md, the search algorithm in LLD-benchmark.md §7.
 Tandem